Tip
GitHub Enterprise Server administrators should instead see Downloading license use for your enterprise or organization.
Viewing a summary of usage
The options available to you vary according to your role and GitHub plan.
GitHub cloud:
- Anyone can view usage data for their own personal account unless their account is managed by their enterprise (EMU).
- If you are an owner or billing manager of an enterprise, or an organization on GitHub Team, you will also have access to usage data for that organization or enterprise account.
GitHub Enterprise Server:
- Enterprise owners can access and download usage data for licenses, see Downloading license use for your enterprise or organization.
Personal accounts
-
Open your billing overview page: https://github.com/settings/billing.
-
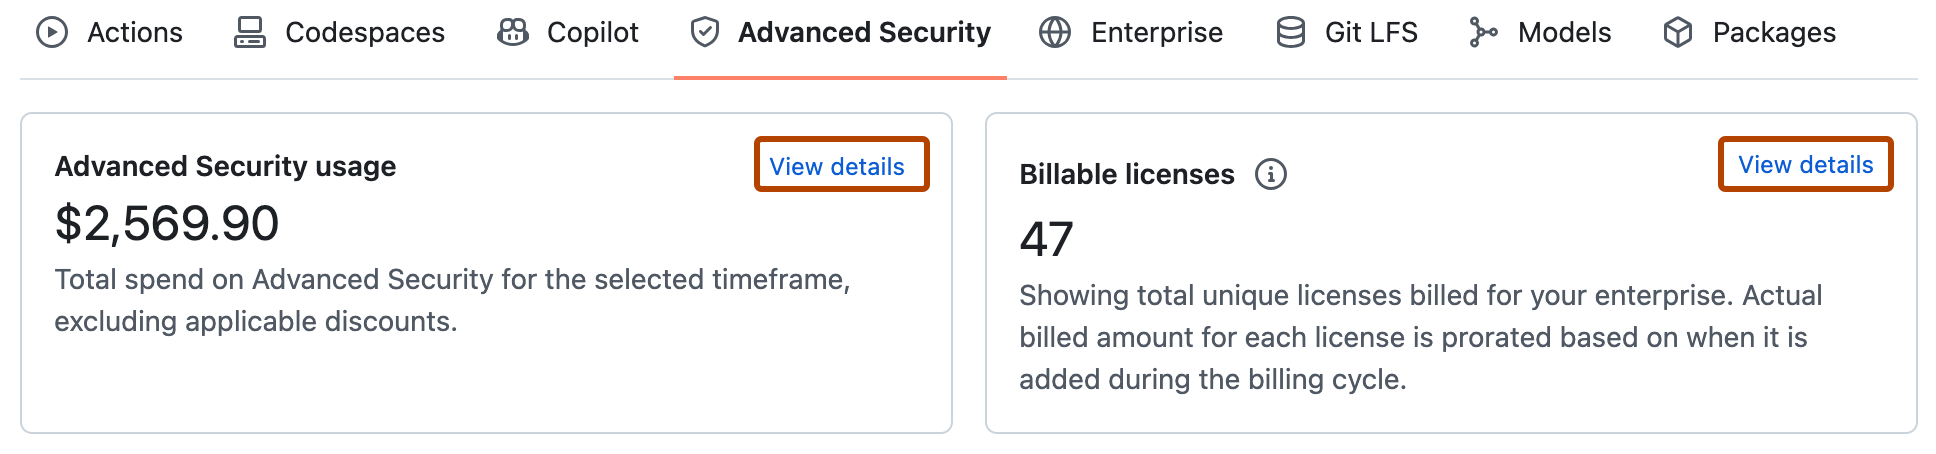
Use the tabbed view to see a summary of consumed use for each product that you use (in this example, the "Advanced Security" tab is shown).
-
Optionally, click View details to show more detailed information.

Organization and enterprise accounts
- Navigate to your organization or enterprise. For example, from the Organizations or Enterprises pages on GitHub.com.
- Click Billing & Licensing to display the billing and licensing overview for the account:
- Organization accounts: under "Access" in the sidebar for settings.
- Enterprise accounts: a separate tab at the top of the page.
Exploring usage data in more detail
You can also explore usage data for all metered products in more detail in the Usage or Metered usage view.
- Filter data on the page: click in the text box to see a list of available filters.
- Group data: options in the "Group" option vary based on the filters you define.
- Choose a time period: use the "Time Frame" option.
The metered usage chart and usage break down table both show your current choice of data.

Downloading usage reports
- Visit the "Metered Usage" page to access a metered billing report for all products.
- At the top of the page, click Get usage report.
- Specify the report details.
- Click Email me the report.
When the report is ready for you to download, you'll receive a message to your primary email account with a link to download the report. The link will expire after 24 hours.
For details of the fields included in the reports, see Billing reports reference.
Downloading the data plotted in the chart
When the chart on the "Metered usage" page shows the data you want to download, click the button and select your preferred format.
