About alerts from code scanning
You can configure code scanning to check the code in a repository using the default CodeQL analysis, a third-party analysis, or multiple types of analysis. When the analysis is complete, the resulting alerts are displayed alongside each other in the security view of the repository. Results from third-party tools or from custom queries may not include all of the properties that you see for alerts detected by GitHub's default CodeQL analysis. For more information, see 코드 스캔을 위한 기본 설정 구성 and 코드 스캔을 위한 고급 설정 구성.
By default, code scanning analyzes your code periodically on the default branch and during pull requests. For information about managing alerts on a pull request, see 끌어오기 요청에서 코드 검사 경고 심사.
You can use GitHub Copilot Autofix to generate fixes automatically for code scanning alerts, including CodeQL alerts. For more information, see 코드 검사 경고 해결.
With a GitHub Copilot Enterprise license, you can also ask GitHub Copilot 채팅 for help to better understand code scanning alerts in repositories in your organization. For more information, see GitHub에서 GitHub Copilot에 질문하기.
For code scanning alerts from CodeQL analysis, you can use security overview to see how CodeQL is performing in pull requests in repositories across your organization, and to identify repositories where you may need to take action. For more information, see pull request 경고에 대한 메트릭 보기.
GitHub 도구를 사용하여 code scanning 경고에 대한 응답으로 수행된 작업을 감사할 수 있습니다. 자세한 내용은 Auditing security alerts을(를) 참조하세요.
About alert details
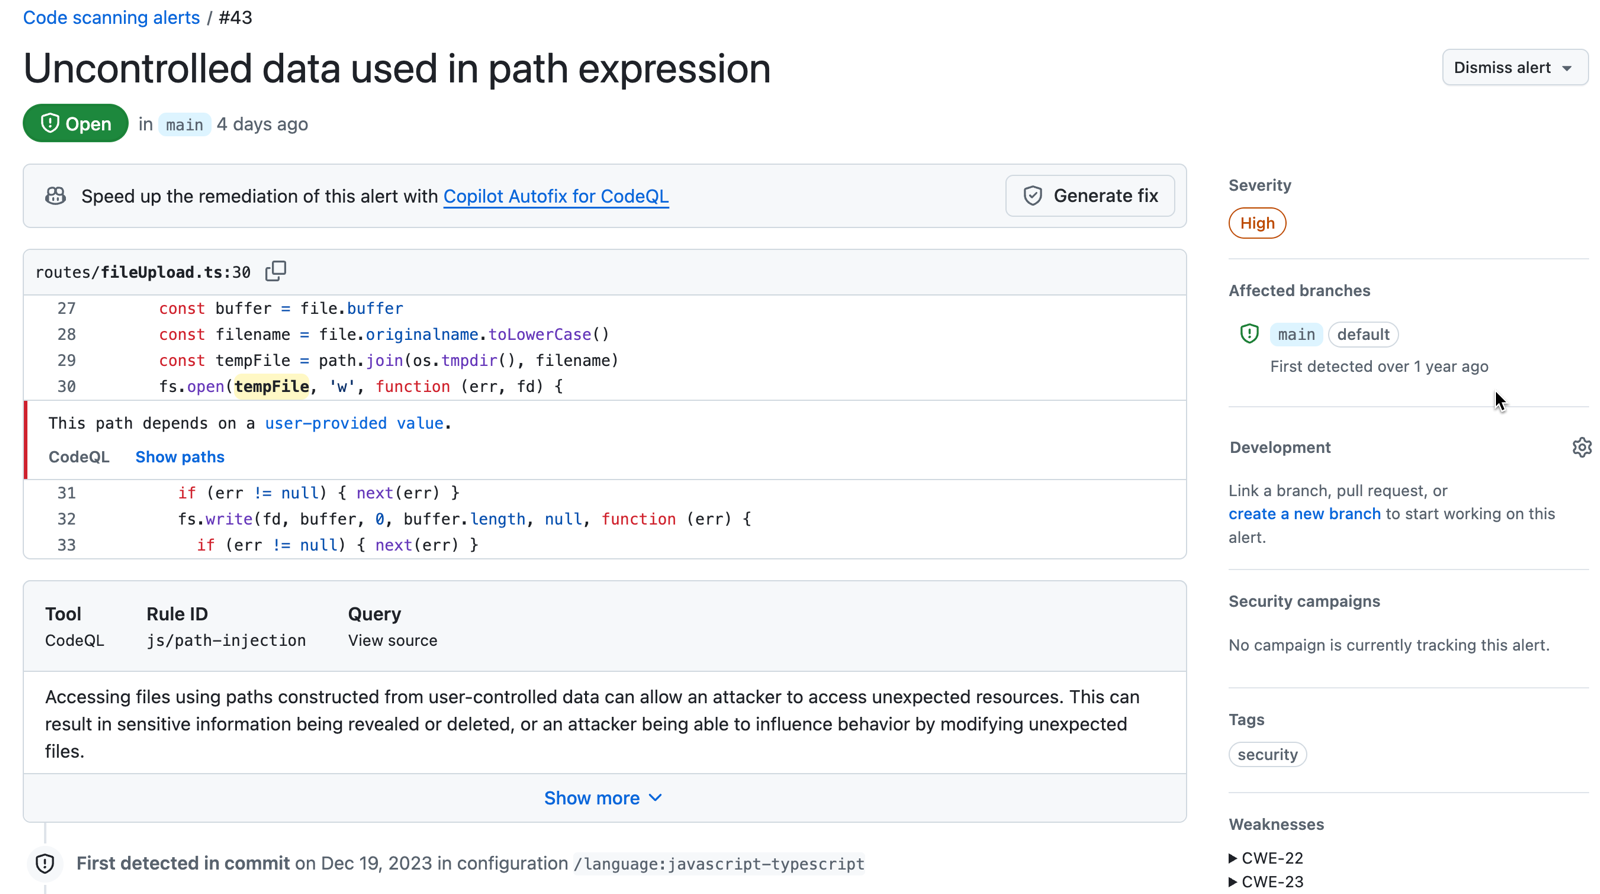
Each alert highlights a problem with the code and the name of the tool that identified it. You can see the line of code that triggered the alert, as well as properties of the alert, such as the alert severity, security severity, and the nature of the problem. Alerts also tell you when the issue was first introduced. For alerts identified by CodeQL analysis, you will also see information on how to fix the problem.
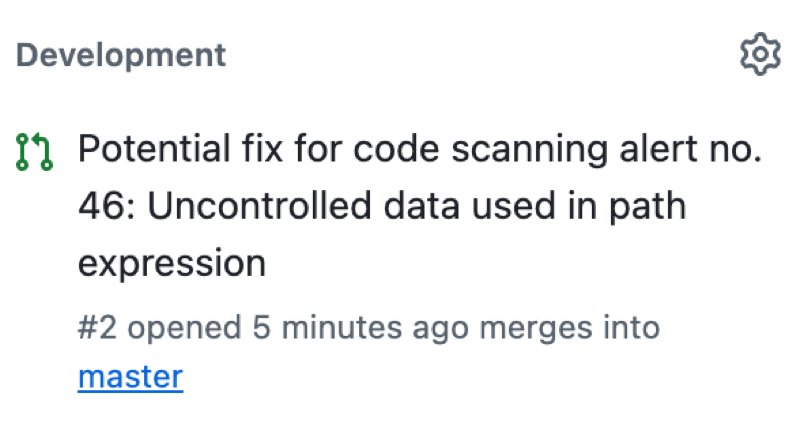
경고 페이지에 있는 상태와 세부 정보는 경고가 다른 분기에 있는 경우에도 리포지토리의 기본 분기에 있는 경고의 상태만 반영합니다. 경고 페이지의 오른쪽에 있는 영향받는 분기 섹션에서 기본 분기가 아닌 분기에 대한 경고 상태를 볼 수 있습니다. 경고가 기본 분기에 없는 경우 경고 상태가 "끌어오기 요청 내" 또는 "분기 내"로 표시되고 회색으로 표시됩니다. Development 섹션에서는 경고를 수정할 연결된 분기 및 끌어오기 요청을 보여 줍니다.

You can also view affected branches, as well as fixes and associated pull requests for an alert. This helps you and your team stay informed about the progress of fixing alerts.

If you configure code scanning using CodeQL, you can also find data-flow problems in your code. Data-flow analysis finds potential security issues in code, such as: using data insecurely, passing dangerous arguments to functions, and leaking sensitive information.
When code scanning reports data-flow alerts, GitHub shows you how data moves through the code. Code scanning allows you to identify the areas of your code that leak sensitive information, and that could be the entry point for attacks by malicious users.
About alerts from multiple configurations
You can run multiple configurations of code analysis on a repository, using different tools and targeting different languages or areas of the code. Each configuration of code scanning generates a unique set of alerts. For example, an alert generated using the default CodeQL analysis with GitHub Actions comes from a different configuration than an alert generated externally and uploaded via the code scanning API.
If you use multiple configurations to analyze a file, any problems detected by the same query are reported as alerts generated by multiple configurations. If an alert exists in more than one configuration, the number of configurations appears next to the branch name in the "Affected branches" section on the right-hand side of the alert page. To view the configurations for an alert, in the "Affected branches" section, click a branch. A "Configurations analyzing" modal appears with the names of each configuration generating the alert for that branch. Below each configuration, you can see when that configuration's alert was last updated.
An alert may display different statuses from different configurations. To update the alert statuses, re-run each out-of-date configuration. Alternatively, you can delete stale configurations from a branch to remove outdated alerts. For more information on deleting stale configurations and alerts, see 코드 검사 경고 해결.
About labels for alerts that are not found in application code
GitHub assigns a category label to alerts that are not found in application code. The label relates to the location of the alert.
- Generated: Code generated by the build process
- Test: Test code
- Library: Library or third-party code
- Documentation: Documentation
Code scanning categorizes files by file path. You cannot manually categorize source files.
In this example, an alert is marked as in "Test" code in the code scanning alert list.

When you click through to see details for the alert, you can see that the file path is marked as "Test" code.

참고 항목
Experimental alerts for code scanning were available a 공개 미리 보기 release for JavaScript using experimental technology in the CodeQL action. This feature was 사용 중지됨. For more information, see CodeQL code scanning deprecates ML-powered alerts.
About alert severity and security severity levels
The severity level for a code scanning alert indicates how much risk the problem adds to your codebase.
- Severity. All code scanning alerts have a level of
Error,Warning, orNote. - Security severity. Each security alert found using CodeQL also has a security severity level of
Critical,High,Medium, orLow.
When an alert has a security severity level, code scanning displays and uses this level in preference to the severity. Security severity levels follow the industry-standard Common Vulnerability Scoring System (CVSS) that is also used for advisories in the GitHub Advisory Database. For more information, see CVSS: Qualitative Severity Rating Scale.
Pull request check failures for code scanning alerts
You can use rulesets to prevent pull requests from being merged when one of the following conditions is met:
- 필수 도구가 규칙 집합에 정의된 심각도에 대한 code scanning 경고를 발견했습니다.
- 필수 code scanning 도구의 분석이 아직 진행 중입니다.
- 필수 code scanning 도구가 리포지토리에 대해 구성되지 않았습니다.
For more information, see 코드 검사 병합 보호 설정. For more general information about rulesets, see 규칙 세트 정보.
Calculation of security severity levels
When a security query is added to the CodeQL Default or Extended query suite, the CodeQL engineering team calculates the security severity as follows.
- Search for all CVEs that are assigned one or more of the CWE tags associated with the new security query.
- Calculate the 75th percentile of the CVSS score for those CVEs.
- Define that score as the security severity for the query.
- When displaying alerts found by the query, translate the numerical scores to
Critical,High,Medium, orLowusing the CVSS definitions.
For more information, see CodeQL CWE coverage on the CodeQL documentation site.