About your code scanning configuration
You can use a variety of tools to configure code scanning in your repository. For more information, see Définition de la configuration par défaut pour l’analyse du code and Configuration de la configuration par défaut pour l’analyse du code.
The log and diagnostic information available to you depends on the method you use for code scanning in your repository. You can check the type of code scanning you're using in the Security tab of your repository, by using the Tool drop-down menu in the alert list. For more information, see Assessing code scanning alerts for your repository.
About analysis and diagnostic information
You can see analysis and diagnostic information for code scanning run using CodeQL analysis on GitHub.
Analysis information is shown for the most recent analysis in a header at the top of the list of alerts. For more information, see Assessing code scanning alerts for your repository.
Diagnostic information is displayed in the Action workflow logs and consists of summary metrics and extractor diagnostics. For information about accessing code scanning logs on GitHub, see Viewing the logging output from code scanning below.
If you're using the CodeQL CLI outside GitHub, you'll see diagnostic information in the output generated during database analysis. This information is also included in the SARIF results file you upload to GitHub with the code scanning results.
For information about the CodeQL CLI, see Analyse de votre code avec des requêtes CodeQL.
About summary metrics
Les métriques récapitulatives sont les suivantes :
- Lignes de code dans le codebase (utilisée comme base de référence), avant la création et l’extraction de la base de données CodeQL
- Lignes de code dans la base de données CodeQL extraite du code, bibliothèques externes et fichiers générés automatiquement compris
- Lignes de code dans la base de données CodeQL, fichiers générés automatiquement et bibliothèques externes non compris
About CodeQL source code extraction diagnostics
Les diagnostics de l’extracteur couvrent uniquement les fichiers vus durant l’analyse. Les métriques incluent notamment les éléments suivants :
- Nombre de fichiers analysés correctement
- Nombre de fichiers ayant généré des erreurs d’extraction durant la création de la base de données
- Nombre de fichiers ayant généré des avertissements d’extraction durant la création de la base de données
You can see more detailed information about CodeQL extractor errors and warnings that occurred during database creation by enabling debug logging. For more information, see Journaux insuffisamment détaillés.
Viewing the logging output from code scanning
This section applies to code scanning run using GitHub Actions (CodeQL or third-party).
After configuring code scanning for your repository, you can watch the output of the actions as they run.
-
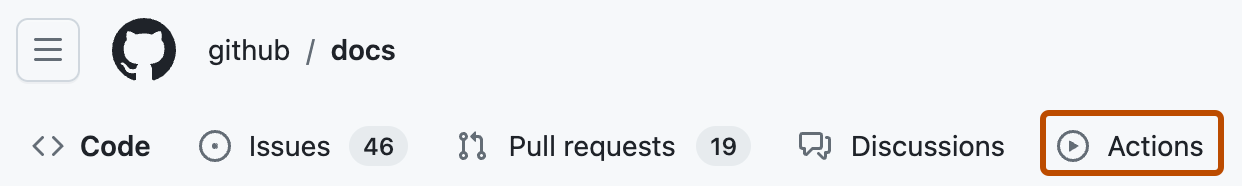
Sous le nom de votre référentiel, cliquez sur Actions.
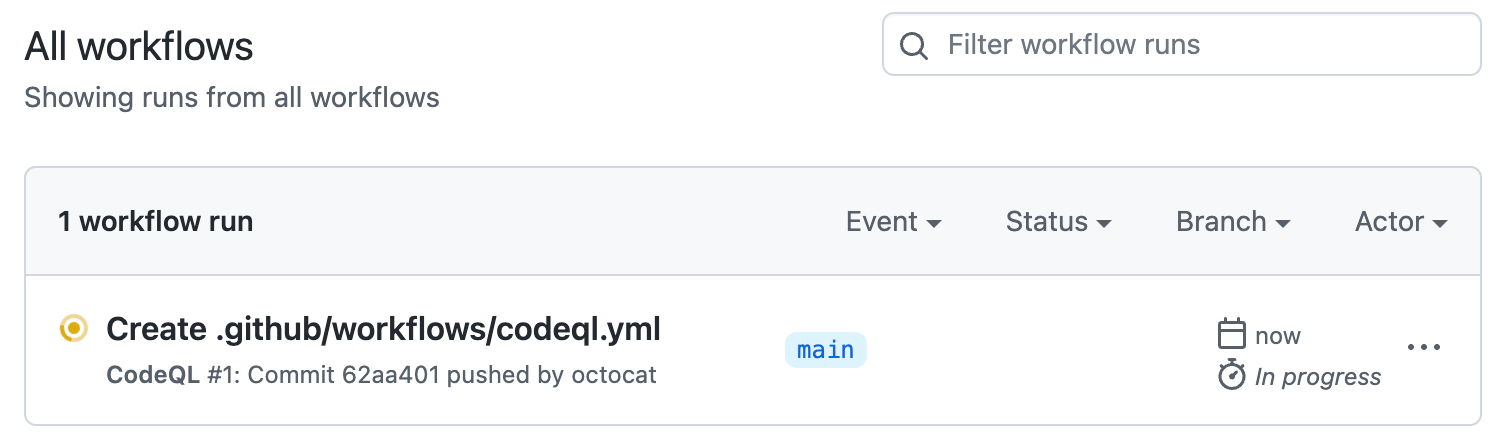
You'll see a list that includes an entry for running the code scanning workflow. The text of the entry is the title you gave your commit message.
-
Click the entry for the code scanning workflow.
Remarque
If you are looking for the CodeQL workflow run triggered by enabling default setup, the text of the entry is "CodeQL."
-
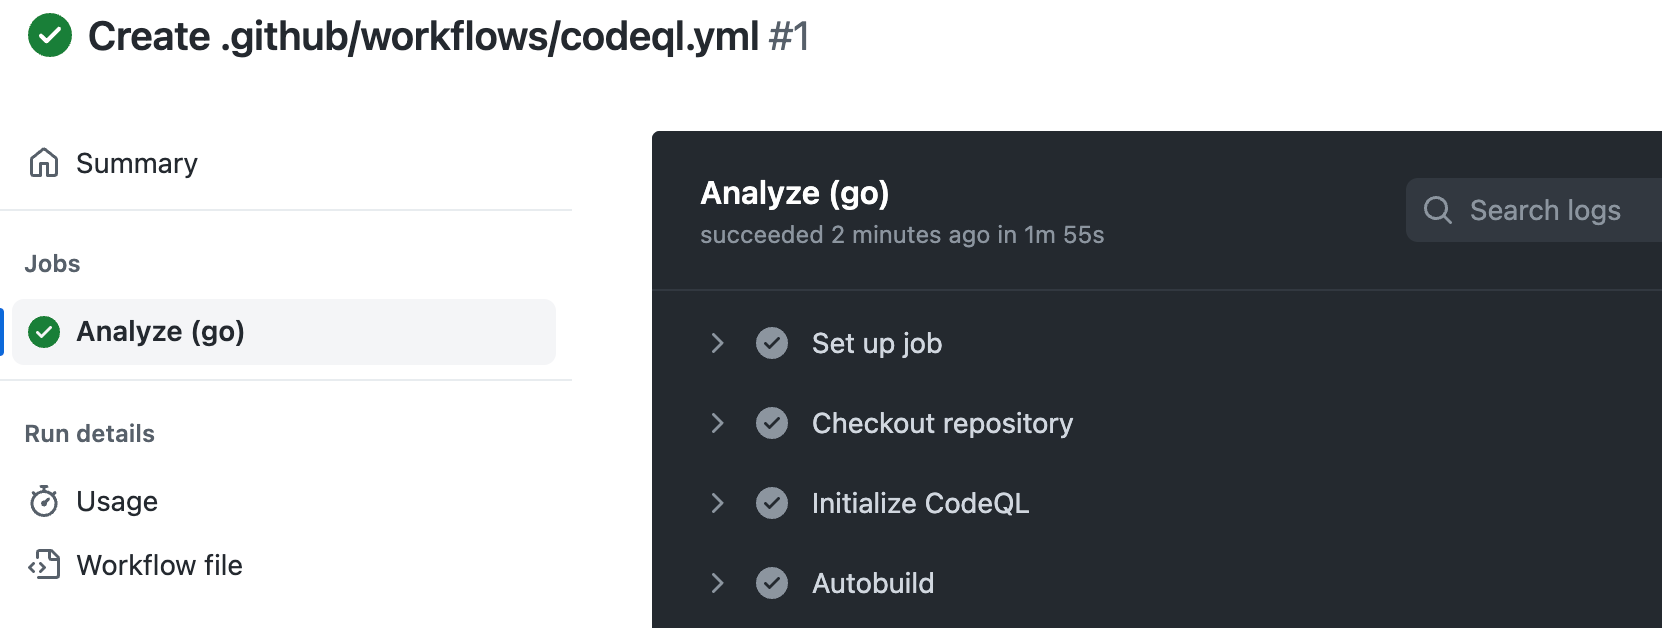
Click the job name on the left. For example, Analyze (LANGUAGE).
-
Review the logging output from the actions in this workflow as they run.
-
Optionally, to see more detail about the commit that triggered the workflow run, click the short commit hash. The short commit hash is 7 lowercase characters immediately following the commit author's username.
-
Once all jobs are complete, you can view the details of any code scanning alerts that were identified. For more information, see Assessing code scanning alerts for your repository.


Determining whether code scanning default setup used any private registries
Code scanning default setup includes a Setup proxy or registries step. When you are looking at a log file for default setup, you can expand this step. If the step includes:
-
Using registries_credentials input.At least one private registry is configured for the organization. -
Credentials loaded for the following registries:- No further output in the step. Access was unsuccessful.
Type: nuget_feed;Default set up accessed a private Nuget feed.Type: maven_repository;Default set up accessed a private Maven repository.
For more information, see Permettre aux dispositifs de sécurité d'accéder aux registres privés.