About the page d’état de l’outil
The page d’état de l’outil shows useful information about all of your code scanning tools. If code scanning is not working as you'd expect, the page d’état de l’outil is a good starting point for debugging problems.
Using the page d’état de l’outil, you can see how well code scanning tools are working for a repository, when files in the repository were first scanned and most recently scanned, and when scans are scheduled. For integrated tools like CodeQL, you can also see more detailed information, including a percentage of files scanned and specific error messages.
You can also see the rules your code was checked against by each configuration of a code scanning tool and download a summary of the results.
Remarque
The page d’état de l’outil shows how tools are working at the repository level, not the organization level. The tool status is only shown for the default branch of the repository for which that tool is configured.
Viewing the page d’état de l’outil for a repository
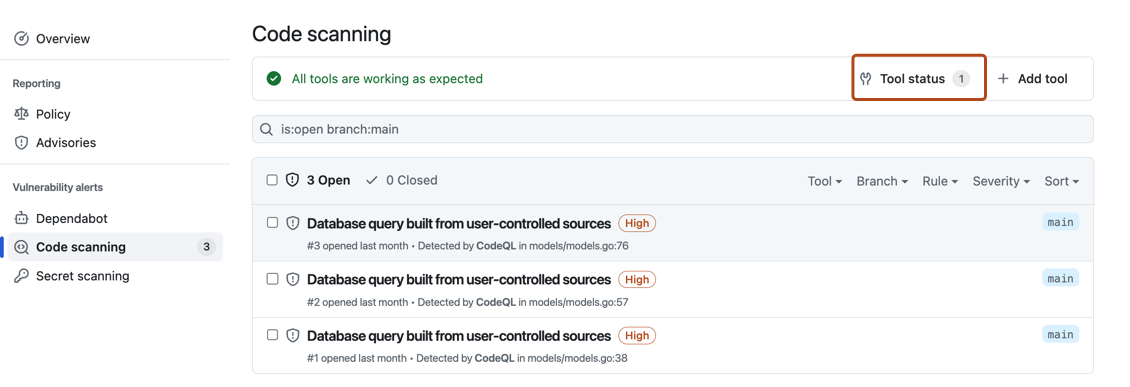
The code scanning alerts page for each repository includes a tools banner with a summary of the health of your code scanning analysis, and access to the page d’état de l’outil to explore your setup.
- Sur GitHub, accédez à la page principale du référentiel.
- Sous le nom du référentiel, cliquez sur Sécurité. Si vous ne voyez pas l’onglet « Sécurité », sélectionnez le menu déroulant et cliquez sur Sécurité.

- Dans la barre latérale gauche, cliquez sur Code scanning.
- Click Tool status in the tools banner.


Using the page d’état de l’outil
In the page d’état de l’outil, you'll see a summary for one tool, highlighted in the sidebar. You can use the sidebar to view summaries for different tools.

For integrated tools such as CodeQL, you can see a percentage total of all the files most recently scanned in your repository, organized by programming language. For information about what files are considered to have been scanned by CodeQL, see How CodeQL defines scanned files. You can also download detailed language reports in CSV format. For more information, see Downloading details of the files analyzed.
The three possible tool statuses are: all configurations are working, some configurations need attention, and some configurations are not working.
Accessing detailed information about tools
When you want to see more detailed information for the currently displayed tool, you can select a specific setup under "Setup types".
Under "Configurations" on the left of the screen, you can see information for each analysis run by this setup type, and any relevant error messages. To see detailed information about the most recent analysis run, select a configuration in the sidebar. You can download details of exactly which rules were run in that scan of the code and how many alerts were found by each rule. For more information, see Downloading lists of rules used.

This view will also show error messages. For more information, see Debugging using the tool status page.
How CodeQL defines scanned files
A file is reported as scanned by CodeQL if some of the lines of code in that file were processed. If you're using a standard configuration of the CodeQL action, the scanned files shown in the page d’état de l’outil will include source code files for all languages that CodeQL can analyze. If you use advanced setup, you can optionally define which files for interpreted languages should be scanned using the paths and paths-ignore configuration properties. For more information, see À propos de l’analyse du code avec CodeQL and Customizing your advanced setup for code scanning.
For compiled languages, the page d’état de l’outil reports files that were present before running autobuild or any manual build steps. This means that files generated during the build process are not shown in the page d’état de l’outil. For more information, see CodeQL code scanning for compiled languages.
The tool status page will calculate the percentage of files that were scanned by CodeQL for each language supported by CodeQL. This percentage respects any files excluded by the paths and paths-ignore configuration properties.
Downloading details of the files analyzed
For integrated tools such as CodeQL, you can download detailed reports from the page d’état de l’outil in CSV format. This will show:
- Which configuration was used to scan each file.
- The file path.
- The programming language of the file.
- Whether the file was successfully extracted.
To download a report, select a tool you're interested in. Then on the top right of the page, click the button.
Downloading lists of rules used
You can download the list of rules that code scanning is checking against, in CSV format. This will show:
- The configuration used.
- The rule source.
- The SARIF identifier.
- How many alerts were found.
To download a report, select a configuration you're interested in. Then click on the top right of the page, and select Download list of rules used.
Removing configurations
You can remove stale, duplicate, or unwanted configurations for the default branch of your repository.
To remove a configuration, select the configuration you want to delete. Then click on the top right of the page, and select Delete configuration. Once you have read the warning about alerts, to confirm the deletion, click the Delete button.
Remarque
You can only use the page d’état de l’outil to remove configurations for the default branch of a repository. For information about removing configurations from non-default branches, see Résoudre les alertes d'analyse de code.
Debugging using the page d’état de l’outil
If you see that there is a problem with your analysis from the code scanning alerts page, you can use the page d’état de l’outil to identify the problem. For integrated tools, you can see specific error messages in the detailed information section, related to specific code scanning tools. These error messages contain information about why the tool may not be performing as expected, and actions you can take. For more information about how to access this section of the page d’état de l’outil, see Accessing detailed information about tools.
For integrated tools such as CodeQL, you can also use file coverage information to improve your analysis. For each language displayed on the page d’état de l’outil:
- If the language has a high scanned percentage, this shows that code scanning is scanning that language as expected.
- If the language has a low scanned percentage, you may wish to investigate diagnostic output produced by CodeQL for that language: for more information see CodeQL scanned fewer lines than expected.
- If the language has a scanned percentage of zero, you may have source code in your repository written in languages supported by CodeQL but not currently being analyzed with CodeQL. In this case, you may wish to update your setup to start analyzing these additional languages. For more information, see Customizing your advanced setup for code scanning.
Remarque
If you have set up CodeQL using advanced setup and then set up default setup on the same repository, the page d’état de l’outil will only show default setup.
For more information, see Troubleshooting analysis errors and Troubleshooting.