About your code scanning configuration
You can use a variety of tools to configure code scanning in your repository. For more information, see コード スキャンの既定セットアップの構成 and コード スキャンの高度なセットアップの構成.
The log and diagnostic information available to you depends on the method you use for code scanning in your repository. You can check the type of code scanning you're using in the Security tab of your repository, by using the Tool drop-down menu in the alert list. For more information, see Assessing code scanning alerts for your repository.
About analysis and diagnostic information
You can see analysis and diagnostic information for code scanning run using CodeQL analysis on GitHub.
Analysis information is shown for the most recent analysis in a header at the top of the list of alerts. For more information, see Assessing code scanning alerts for your repository.
Diagnostic information is displayed in the Action workflow logs and consists of summary metrics and extractor diagnostics. For information about accessing code scanning logs on GitHub, see Viewing the logging output from code scanning below.
If you're using the CodeQL CLI outside GitHub, you'll see diagnostic information in the output generated during database analysis. This information is also included in the SARIF results file you upload to GitHub with the code scanning results.
For information about the CodeQL CLI, see CodeQL クエリによるコード分析.
About summary metrics
サマリのメトリクスには以下が含まれます。
- CodeQLデータベースの作成と抽出前のコードベース中のコードの行数(ベースラインとして使われます)
- 外部ライブラリと自動生成されたファイルを含む、コードから抽出されたCodeQLデータベース中のコードの行数
- 自動生成されたファイルと外部ライブラリを除く、CodeQLデータベース中のコードの行数
About CodeQL source code extraction diagnostics
抽出診断は分析の間に見られたファイルのみをカバーし、以下のメトリクスを含みます。
- 分析に成功したファイル数
- データベースの作成中に抽出エラーを生成したファイル数
- データベースの作成中に抽出の警告を生成したファイル数
You can see more detailed information about CodeQL extractor errors and warnings that occurred during database creation by enabling debug logging. For more information, see ログの詳細が十分ではない.
Viewing the logging output from code scanning
This section applies to code scanning run using GitHub Actions (CodeQL or third-party).
After configuring code scanning for your repository, you can watch the output of the actions as they run.
-
リポジトリ名の下にある [ Actions] をクリックします。
!["github/docs" リポジトリのタブのスクリーンショット。 [アクション] タブがオレンジ色の枠線で強調表示されています。](/assets/cb-12958/images/help/repository/actions-tab-global-nav-update.png)
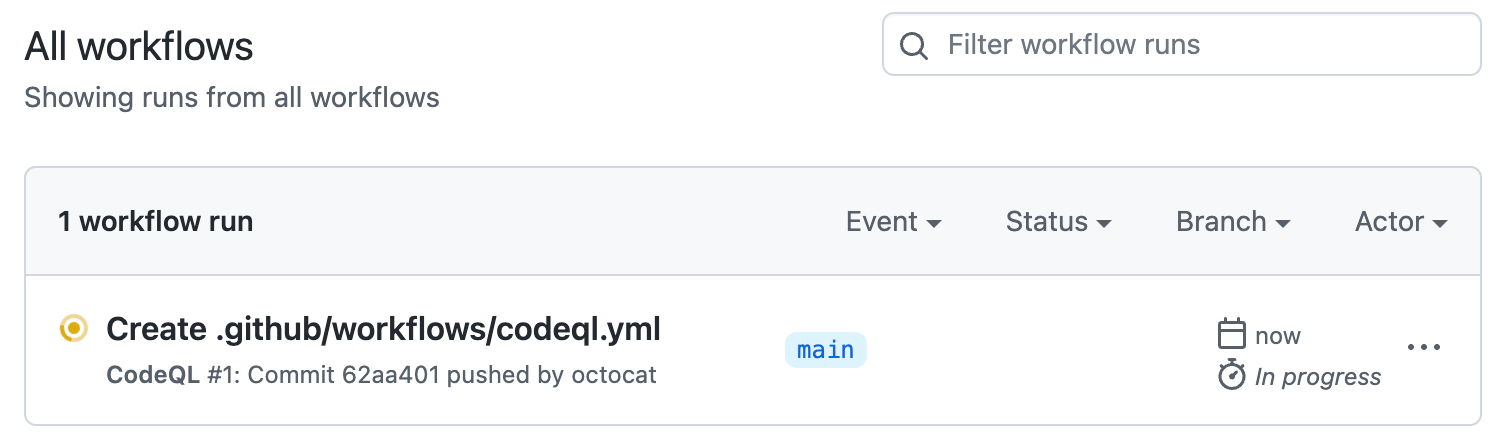
You'll see a list that includes an entry for running the code scanning workflow. The text of the entry is the title you gave your commit message.
-
Click the entry for the code scanning workflow.
メモ
If you are looking for the CodeQL workflow run triggered by enabling default setup, the text of the entry is "CodeQL."
-
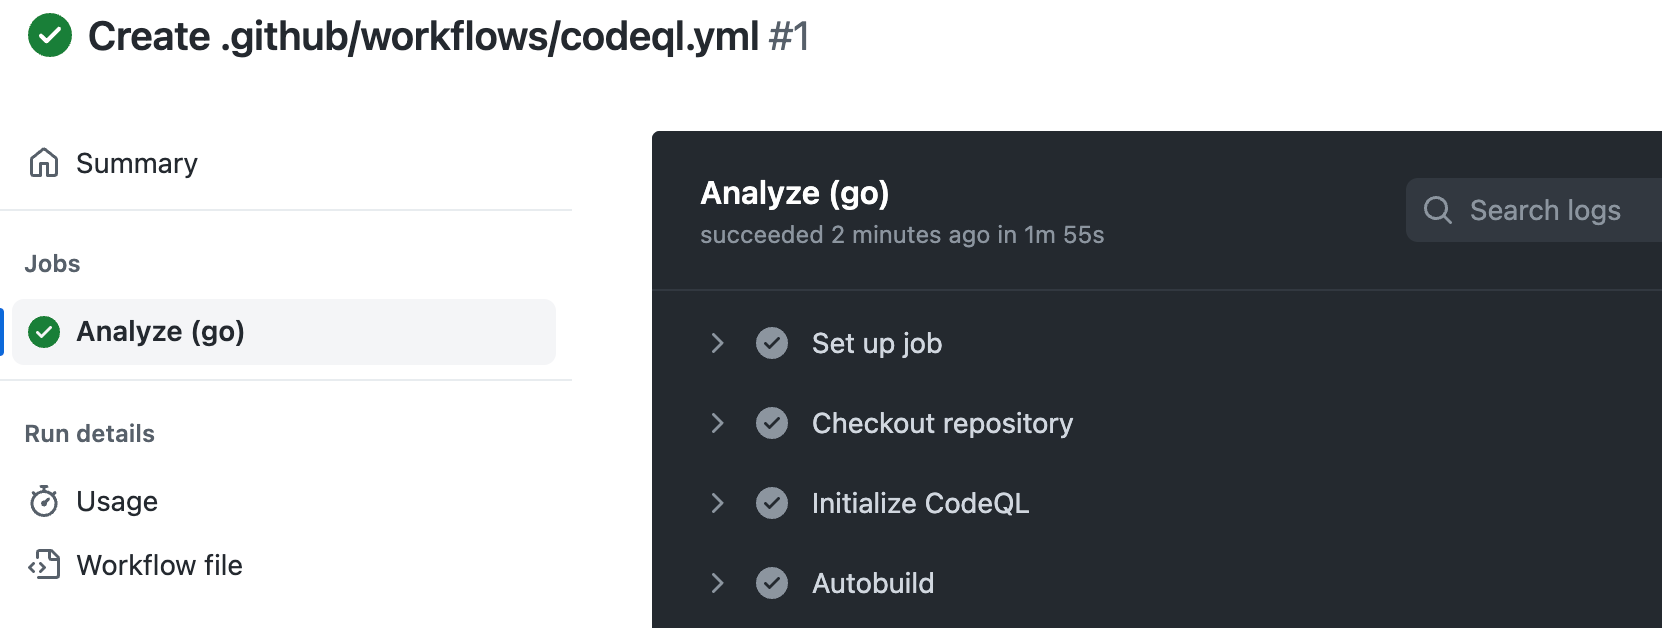
Click the job name on the left. For example, Analyze (LANGUAGE).
-
Review the logging output from the actions in this workflow as they run.
-
Optionally, to see more detail about the commit that triggered the workflow run, click the short commit hash. The short commit hash is 7 lowercase characters immediately following the commit author's username.
-
Once all jobs are complete, you can view the details of any code scanning alerts that were identified. For more information, see Assessing code scanning alerts for your repository.
!["github/docs" リポジトリのタブのスクリーンショット。 [アクション] タブがオレンジ色の枠線で強調表示されています。](/assets/cb-12958/mw-1440/images/help/repository/actions-tab-global-nav-update.webp)


Determining whether code scanning default setup used any private registries
Code scanning default setup includes a Setup proxy or registries step. When you are looking at a log file for default setup, you can expand this step. If the step includes:
-
Using registries_credentials input.At least one private registry is configured for the organization. -
Credentials loaded for the following registries:- No further output in the step. Access was unsuccessful.
Type: nuget_feed;Default set up accessed a private Nuget feed.Type: maven_repository;Default set up accessed a private Maven repository.
For more information, see セキュリティ機能にプライベート レジストリへのアクセスを許可する.